这部分内容需要加载的库 ↓
using VegaLite, VegaDatasets
@vlplot
@vlplot 宏命令是 VegaLite 中用于绘图的重要宏命令。
具体来看应用:以著名的 cars 数据集为例 ↓
cars = dataset("cars")
| Miles_per_Gallon | Cylinders | Origin | Weight_in_lbs | Displacement | Acceleration | Name | Year | Horsepower |
|---|---|---|---|---|---|---|---|---|
| 18.0 | 8 | "USA" | 3504 | 307.0 | 12.0 | "chevrolet chevelle malibu" | "1970-01-01" | 130 |
| 15.0 | 8 | "USA" | 3693 | 350.0 | 11.5 | "buick skylark 320" | "1970-01-01" | 165 |
| 18.0 | 8 | "USA" | 3436 | 318.0 | 11.0 | "plymouth satellite" | "1970-01-01" | 150 |
| 16.0 | 8 | "USA" | 3433 | 304.0 | 12.0 | "amc rebel sst" | "1970-01-01" | 150 |
| 17.0 | 8 | "USA" | 3449 | 302.0 | 10.5 | "ford torino" | "1970-01-01" | 140 |
| 15.0 | 8 | "USA" | 4341 | 429.0 | 10.0 | "ford galaxie 500" | "1970-01-01" | 198 |
| 14.0 | 8 | "USA" | 4354 | 454.0 | 9.0 | "chevrolet impala" | "1970-01-01" | 220 |
| 14.0 | 8 | "USA" | 4312 | 440.0 | 8.5 | "plymouth fury iii" | "1970-01-01" | 215 |
| 14.0 | 8 | "USA" | 4425 | 455.0 | 10.0 | "pontiac catalina" | "1970-01-01" | 225 |
| 15.0 | 8 | "USA" | 3850 | 390.0 | 8.5 | "amc ambassador dpl" | "1970-01-01" | 190 |
| ⋮ | ⋮ | ⋮ | ⋮ | ⋮ | ⋮ | ⋮ | ⋮ | ⋮ |
... with 396 more rows.
可视化代码 ↓
cars |>
@vlplot(
    :point,
    x=:Horsepower,
    y=:Miles_per_Gallon
)
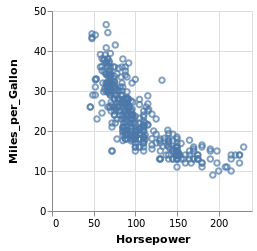
|> 为管道操作符,实现函数链式调用功能。
: 是一种速写字符串语法(Shorthand string syntax):
-
:point实际上是指mark=:point; -
x=:Horsepower指定了 cars 数据中的 Horsepower 数据作为 x轴,等价于x="Horsepower"; -
y=:Miles_per_Gallon指定了 cars 数据中的 Miles_per_Gallon 数据作为 y轴,等价于y="Miles_per_Gallon"。
速写字符串语法(Shorthand string syntax)
| type | abbr | 意义 |
|---|---|---|
| :q | quantitative | 连续型 |
| :n | nominal | 离散型 |
| :o | ordinal | 有序离散/连续型 |
| :t | time serial | 时间类型 |
字符型数据
字符串型数据 → 默认为离散型变量。
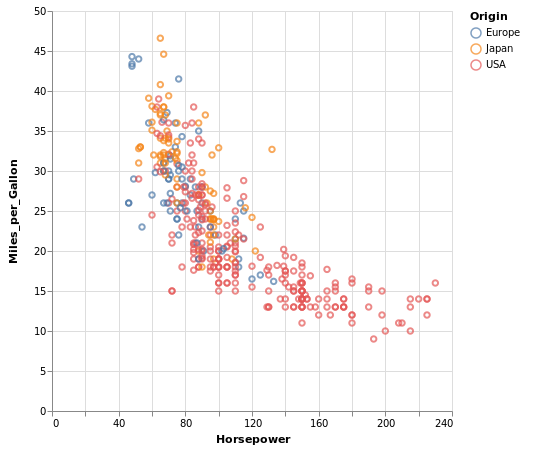
继续上面的例子,我们以离散型颜色区分不同国家的数据情况。
cars |>
@vlplot(
    :point,
    x=:Horsepower,
    y=:Miles_per_Gallon,
    color=:Origin,
    width=400,
    height=400
)
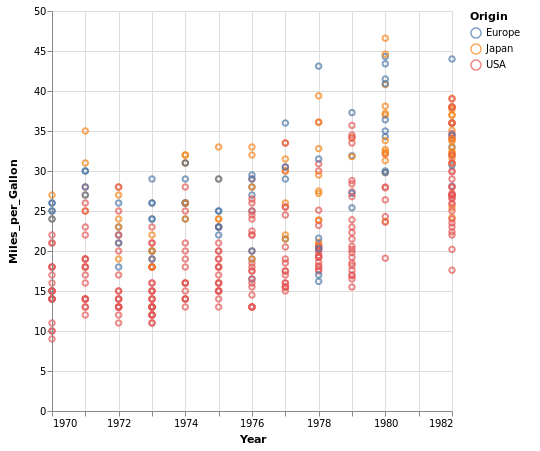
日期型字符串可转化成日期格式 ↓
cars |>
@vlplot(
    :point,
    x={"year(Year):t", axis={title="Year"}},
    y=:Miles_per_Gallon,
    color=:Origin,
    width=400,
    height=400
)
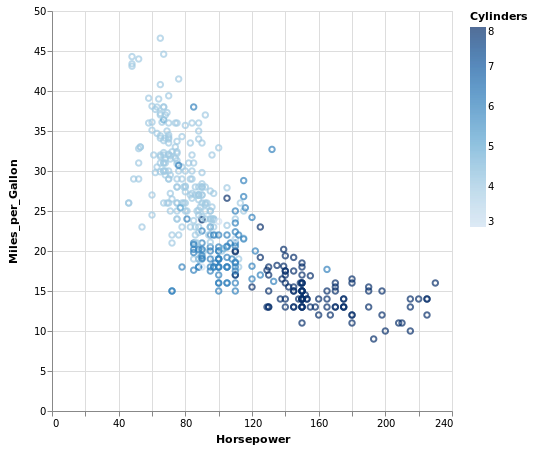
数值型数据
数值型数据 → 默认为连续型变量。
比如以颜色区分,可将数值转化成离散型变量( color="var:n" )或者使用渐变颜色( color="var:o" ) ↓
cars |>
@vlplot(
    :point,
    x=:Horsepower,
    y=:Miles_per_Gallon,
    color=:Cylinders, # 默认为连续型变量
    width=400,
    height=400
)
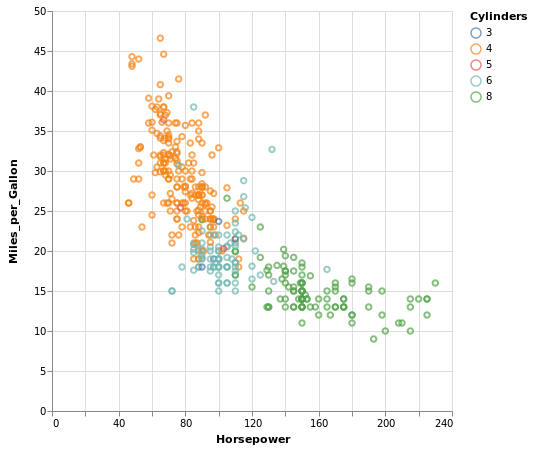
cars |>
@vlplot(
    :point,
    x=:Horsepower,
    y=:Miles_per_Gallon,
    color="Cylinders:n", # :n 表示 nominal,将数值型变量转化成离散型变量
    width=400,
    height=400
)
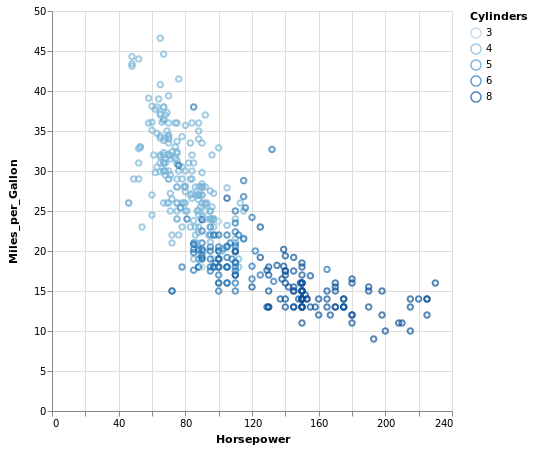
cars |>
@vlplot(
    :point,
    x=:Horsepower,
    y=:Miles_per_Gallon,
    color="Cylinders:o", # :o 表示 ordinal
    width=400,
    height=400
)
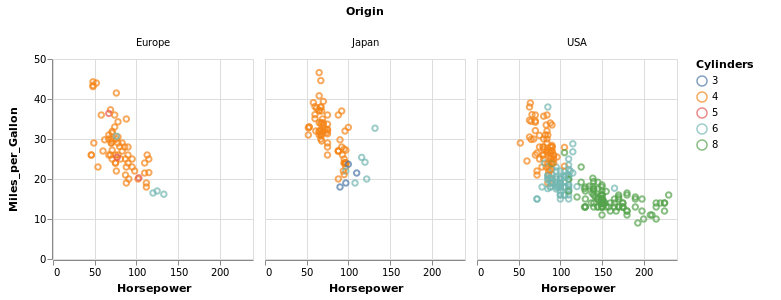
分面 (facet)
在 VegaLite 里使用分面相当简单,使用 column 或者 row 参数,指定相应数据即可 ↓
cars |>
@vlplot(
    :point,
    x=:Horsepower,
    y=:Miles_per_Gallon,
    color="Cylinders:n",
    column=:Origin,
    width=200,
    height=200
)
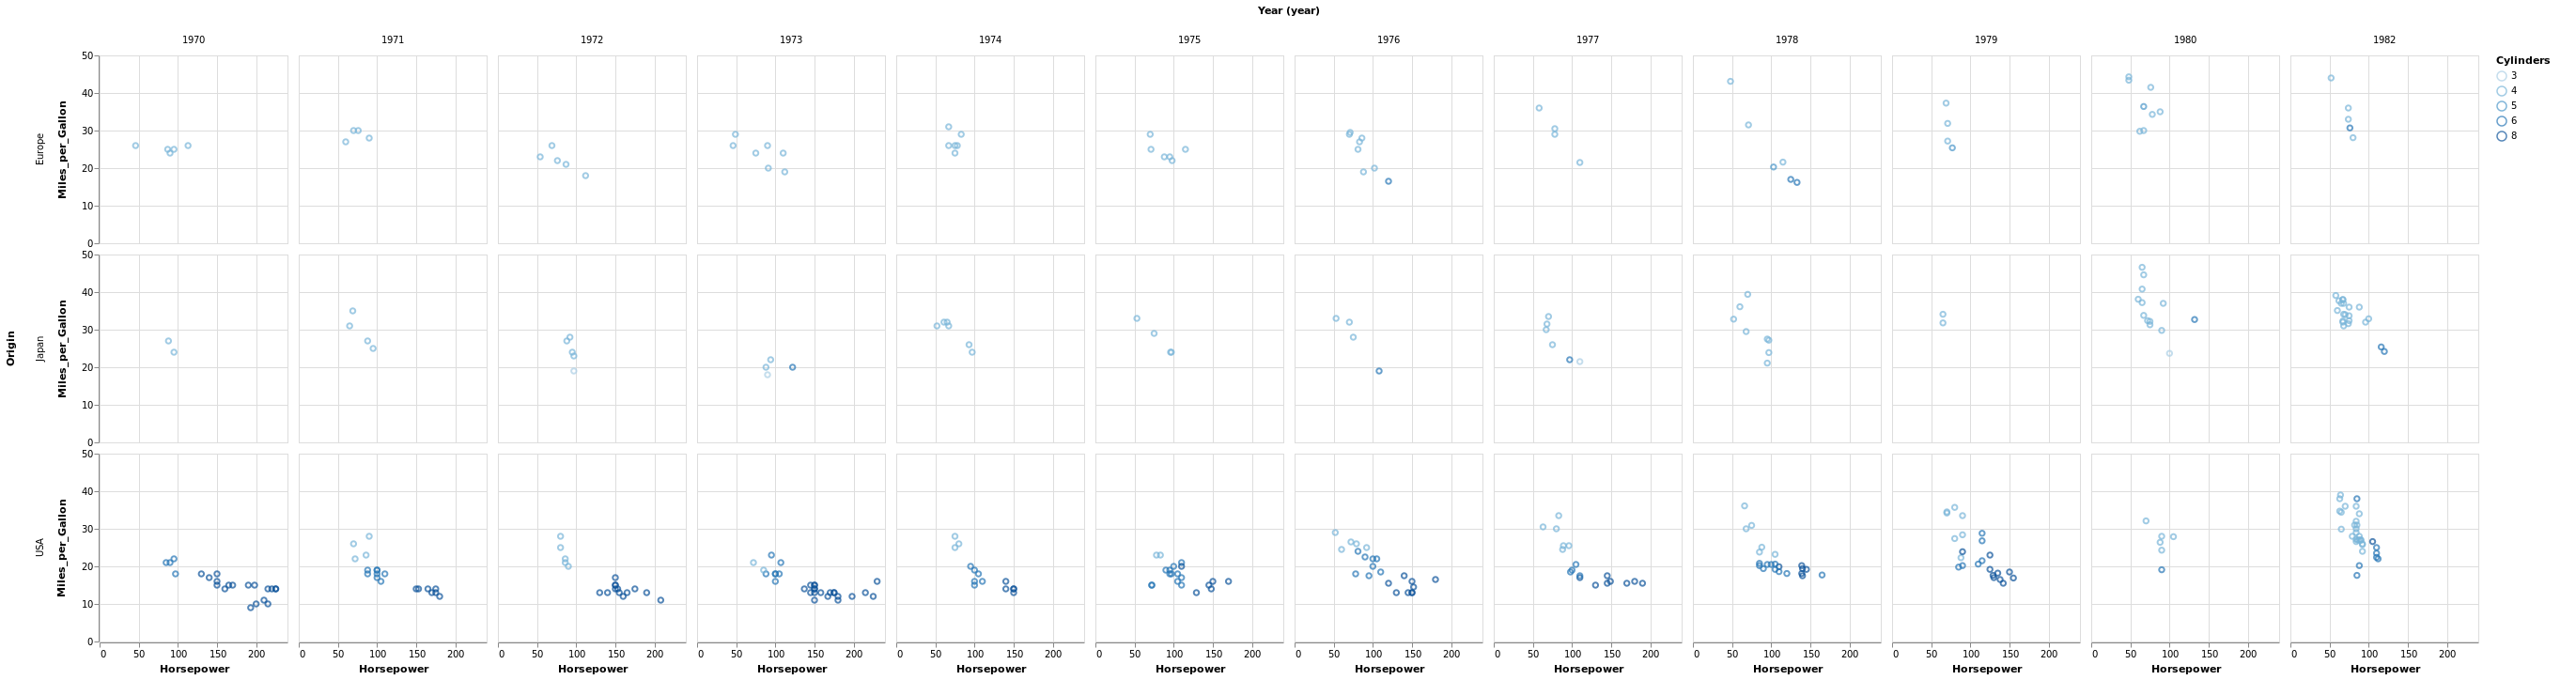
cars |>
@vlplot(
    :point,
    x=:Horsepower,
    y=:Miles_per_Gallon,
    color="Cylinders:o",
    column="year(Year):o",
    row=:Origin,
    width=200,
    height=200
)
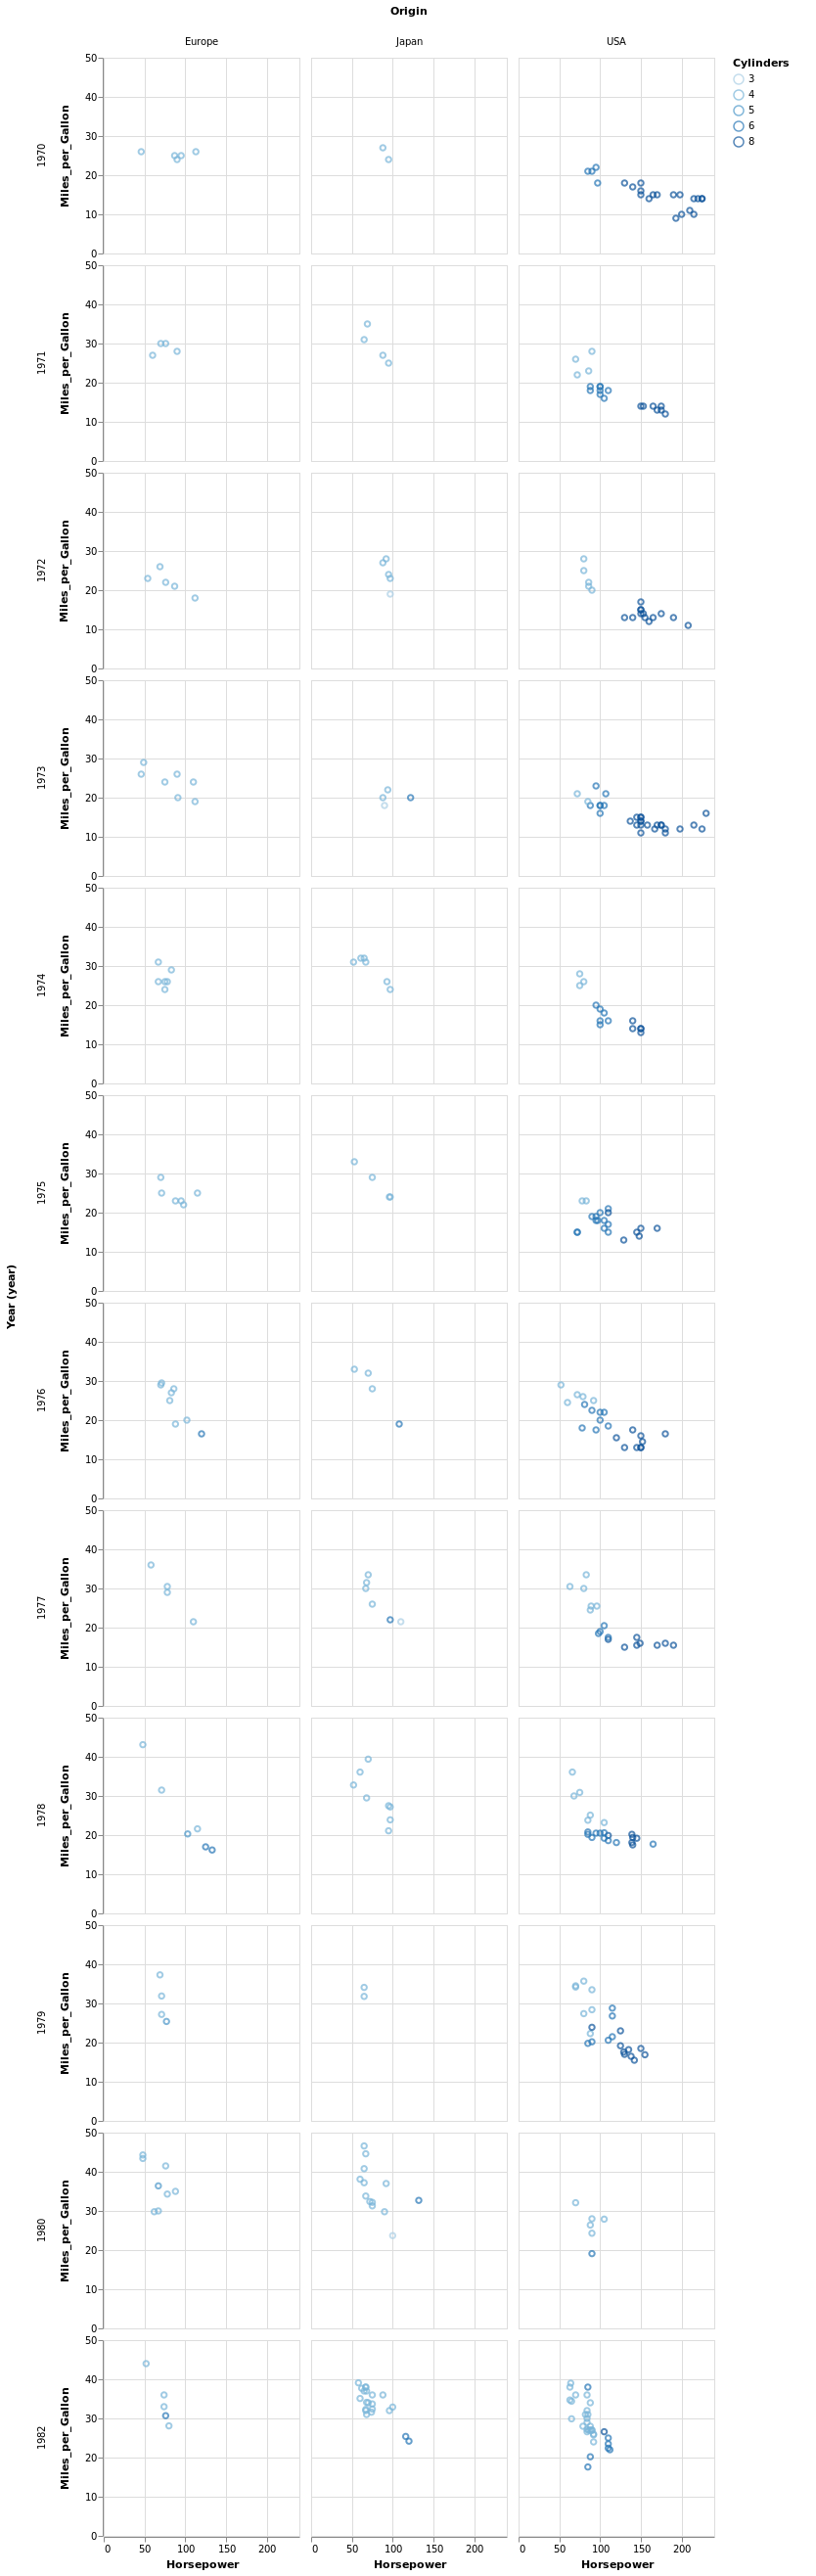
cars |>
@vlplot(
    :point,
    x=:Horsepower,
    y=:Miles_per_Gallon,
    color="Cylinders:o",
    column=:Origin,
    row="year(Year):o",
    width=200,
    height=200
)