这部分内容需要加载的库 ↓
using VegaLite
vl 字符串宏
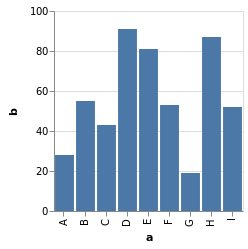
vl 字符串宏提供了直接在 Julia 代码中嵌入运行 VegaLite Json 格式代码的功能。
例子
vl 字符串宏提供了直接在 Julia 代码中嵌入运行 VegaLite Json 格式代码的功能。
spec = vl"""{
  "data": {
    "values": [
      {"a": "A","b": 28}, {"a": "B","b": 55}, {"a": "C","b": 43},
      {"a": "D","b": 91}, {"a": "E","b": 81}, {"a": "F","b": 53},
      {"a": "G","b": 19}, {"a": "H","b": 87}, {"a": "I","b": 52}
    ]
  },
  "mark": "bar",
  "encoding": {
    "x": {"field": "a", "type": "ordinal"},
    "y": {"field": "b", "type": "quantitative"}
  }
}""";
spec

@vlplot VS Vega-Lite JSON 格式
使用 vl 只需要把 JSON 字符串代码贴进来,而 @vlplot 需要 “手工翻译” Json 格式代码。
例子
一段简单的 Vega-Lite JSON 可视化代码 ↓
{
  "data": {
    "values": [
      {"a": "A","b": 28}, {"a": "B","b": 55}, {"a": "C","b": 43},
      {"a": "D","b": 91}, {"a": "E","b": 81}, {"a": "F","b": 53},
      {"a": "G","b": 19}, {"a": "H","b": 87}, {"a": "I","b": 52}
    ]
  },
  "mark": "bar",
  "encoding": {
    "x": {"field": "a", "type": "ordinal"},
    "y": {"field": "b", "type": "quantitative"}
  }
}
在 Vega Editor 中运行结果如下 ↓
用 @vlplot 将上面的 Json 代码翻译过来,如下
@vlplot(
    data={
        values=[
            {a="A",b=28},{a="B",b=55},{a="C",b=43},
            {a="D",b=91},{a="E",b=81},{a="F",b=53},
            {a="G",b=19},{a="H",b=87},{a="I",b=52}
        ]
    },
    mark="bar",
    encoding={
        x={field="a", typ="ordinal"},
        y={field="b", typ="quantitative"}
    }
)

说明
可以看到 @vlplot 宏命令对 VegaLite Json 格式做了些调整:
-
去掉了最外层的
{},首尾用以宏调用的()代替。 -
Json 格式中键两边的
"(双引号) 去掉了。 -
Json 格式中键与值的分隔符
:用=代替。 -
Json 格式中名称为
type的键在@vlplot宏中被命名为typ(因为type是Julia预留的关键字,此处不可用)。 -
在调用
@vlplot时, Json 格式中的任何null值应该替换成nothing(
nothing是一个值,比如需要 x轴 无 title,应该这样写:x={:var, title=nothing};需要 x轴 无 刻度,应该这样写:x={:var, axis=nothing} )。
# 将 Json 中的数据代码部分解析成 Julia DataFrame 数据格式
using DataFrames
import JSON

s = """{
  "data": {
    "values": [
      {"a": "A","b": 28}, {"a": "B","b": 55}, {"a": "C","b": 43},
      {"a": "D","b": 91}, {"a": "E","b": 81}, {"a": "F","b": 53},
      {"a": "G","b": 19}, {"a": "H","b": 87}, {"a": "I","b": 52}
    ]
  }
}""";

ss = JSON.parse(s)["data"]["values"];
# data = DataFrame(a = [item["a"] for item in ss], b = [item["b"] for item in ss])
temp = [[item["a"], item["b"]] for item in ss];
data = DataFrame(a = getindex.(temp, 1), b = getindex.(temp, 2))
| a | b | |
|---|---|---|
| 1 | A | 28 |
| 2 | B | 55 |
| 3 | C | 43 |
| 4 | D | 91 |
| 5 | E | 81 |
| 6 | F | 53 |
| 7 | G | 19 |
| 8 | H | 87 |
| 9 | I | 52 |
使用 速写字符串语法(Shorthand string syntax) ↓
data |>
@vlplot(
    mark=:bar, # Note how we use :point instead of "point" here
    encoding={
        x={
            field=:a, # Note how we use :a instead of "a" here
            typ=:ordinal # Note how we use :ordinal instead of "ordinal" here
        },
        y={
            field=:b, # Note how we use :b instead of "b" here
            typ=:quantitative # Note how we use :quantitative instead of "quantitative" here
        }
    }
)

呃,看着好像也没比 Json 格式简洁多少…
但是,我们有更简洁的写法 ↓
data |>
@vlplot(
    :bar,
    x=:a, # string 类型默认 type 为 ordinal
    y=:b # 数值类型默认 type 为 quantitive
)

IO: VegaLite Json 格式文件
savespec 和 loadspec 提供将 VegaLite Json 格式的文件保存或者读取。(在未来的版本中,将被 save 和 load 替代)
将上面的 vl 部分的例子保存成 JSON 格式 ↓
savespec("myfigure.vegalite", spec)

# "myfigure.vegalite" 文件中的内容为:
# {"encoding":{"x":{"field":"a","type":"ordinal"},"y":{"field":"b","type":"quantitative"}},"mark":"bar"}
# 注意 "data" 键的数据被去掉了
spec = loadspec("myfigure.vegalite");
spec.params

# 结果
#    Dict{String,Any} with 2 entries:
#      "encoding" => Dict{String,Any}(Pair{String,Any}("x", Dict{String,Any}(Pair{St…
#      "mark"     => "bar"