比如说用下面这个例子,我之前在atom里运行的时候,会弹出一个窗口,里面是可以用鼠标拖动的三维图形,但是我昨天升级了一次atom后,运行这个就只会在atom的Plots里显示一张图片。
如果是在julia的repl里直接运行的话,是会弹出能用鼠标拖动的三维图形的窗口。
在atom里该怎么搞啊?
using Makie
 large_sphere = Sphere(Point3f0(0), 1f0)
 positions = decompose(Point3f0, large_sphere)
 linepos = view(positions, rand(1:length(positions), 1000))
 scene = lines(linepos, linewidth = 0.1, color = :black)
 scatter!(scene, positions, strokewidth = 10, strokecolor = :white, color = RGBAf0(0.9, 0.2, 0.4, 0.6))
 scene
    Status `C:\Users\.julia\environments\v1.1\Project.toml`
  [c52e3926] Atom v0.8.7
  [336ed68f] CSV v0.5.5
  [aaaa29a8] Clustering v0.13.1
  [a93c6f00] DataFrames v0.18.3
  [5789e2e9] FileIO v1.0.6
  [1c8ee90f] IterableTables v0.11.0
  [e5e0dc1b] Juno v0.7.0
  [b964fa9f] LaTeXStrings v1.0.3
  [ee78f7c6] Makie v0.9.4
  [1dea7af3] OrdinaryDiffEq v5.8.1
  [91a5bcdd] Plots v0.25.1
  [d330b81b] PyPlot v2.8.1
  [276daf66] SpecialFunctions v0.7.2
  [10745b16] Statistics
atom 版本是
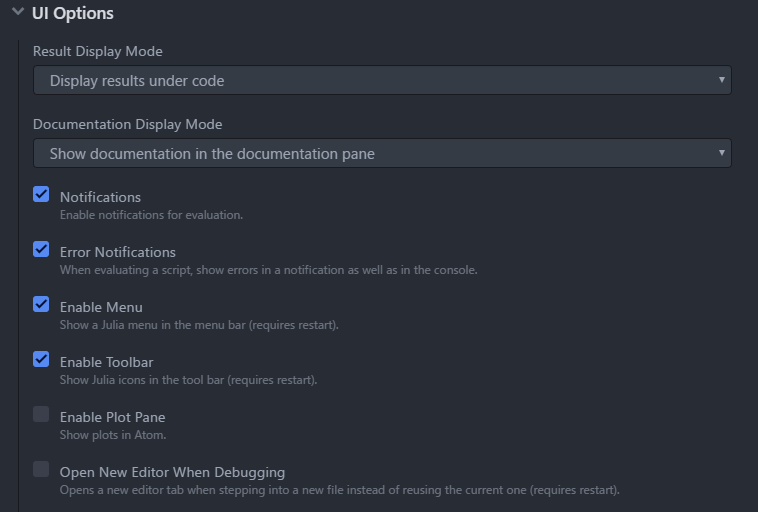
在atom的设置里找到了这个,把enable plot pane 的勾去了就能显示了。但原来是那个窗口和图片能同时显示,不知道该怎么调。