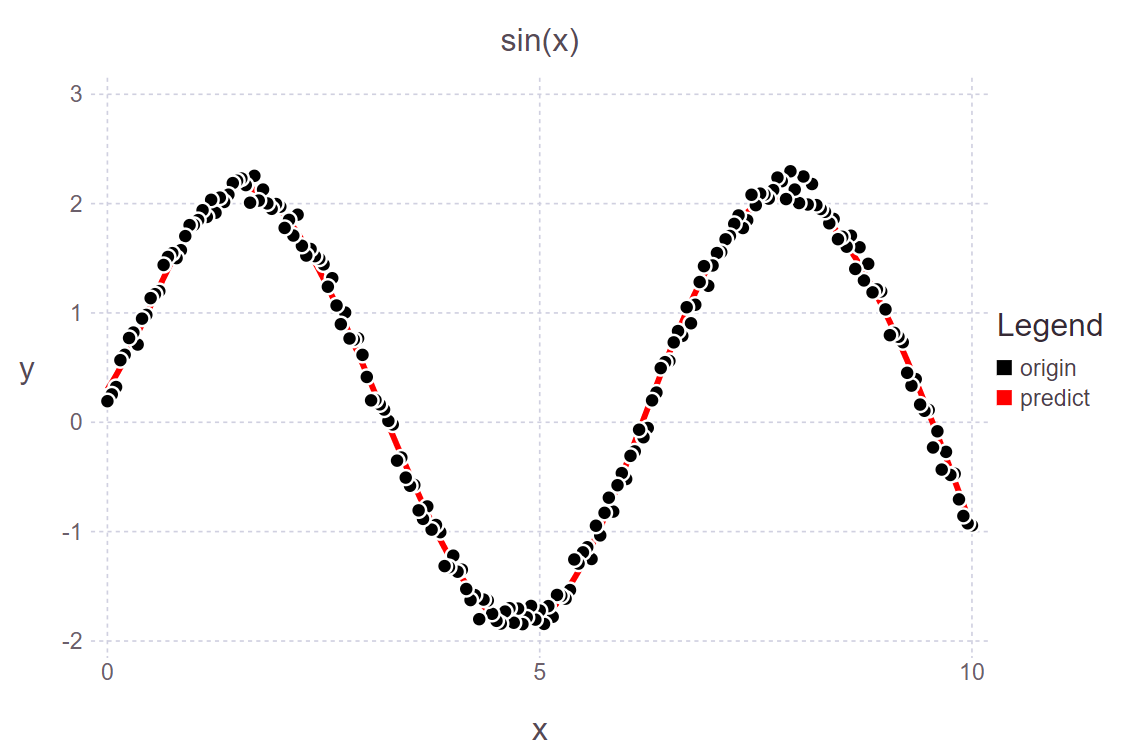
问题描述:拟合y=sin(x),数据集选取0<x<10;
# ----------(x) -> f(x)--------------
using Flux;
using Flux: @epochs, throttle;

# 产生数据集
xs = reshape(collect(0:0.05:10.0), 1, :);
ys = 2.0.*sin.(xs) .+ 0.3*rand(1, length(xs));
# ys = 3.0 .* xs .+ 2.0 .+ 1.5 .* rand(1, length(xs));
dataset = [(xs, ys)];  # or dataset = Iterators.repeated((xs, ys), 1000)

# 定义模型
m = Chain(Dense(1, 15, tanh),
    Dense(15, 10),
    Dense(10, 1));

loss(x, y) = Flux.mse(m(x), y); # 定义误差函数
evalcb() = @show(loss(xs, ys))
opt = ADAM();
ps = Flux.params(m);

# 训练模型
# @epochs 10000 Flux.train!(loss, ps, dataset, opt, cb = throttle(evalcb, 10));
for i in 1:3000
    Flux.train!(loss, ps, dataset, opt);
    if i%100 == 0
        println("$(i) steps loss is $(loss(xs, ys))")
    end
end

# 绘制数据图像
using Gadfly;
l1 = Gadfly.layer(x=xs, y=ys, Geom.point, Theme(default_color="black"));
Gadfly.plot(l1, Guide.xlabel("x"), Guide.ylabel("y"), Guide.title("sin(x)"), Guide.manual_color_key("Legend", ["origin"], ["black"]))
# x0 = xs;
# println("真实值:$(2.0.*sin.(x0));", "预测值:$(Float64.(m(x0).data))")
l2 = Gadfly.layer(x=xs, y=m(xs).data, Geom.line, Theme(default_color="red",line_width=2pt))
p = Gadfly.plot(l1, l2, Guide.xlabel("x"), Guide.ylabel("y"), Guide.title("sin(x)"), Guide.manual_color_key("Legend", ["origin", "predict"], ["black", "red"]))
p |> SVG("example7_1D.SVG")
输出结果图片如下: