首先提醒,本内容待完善。
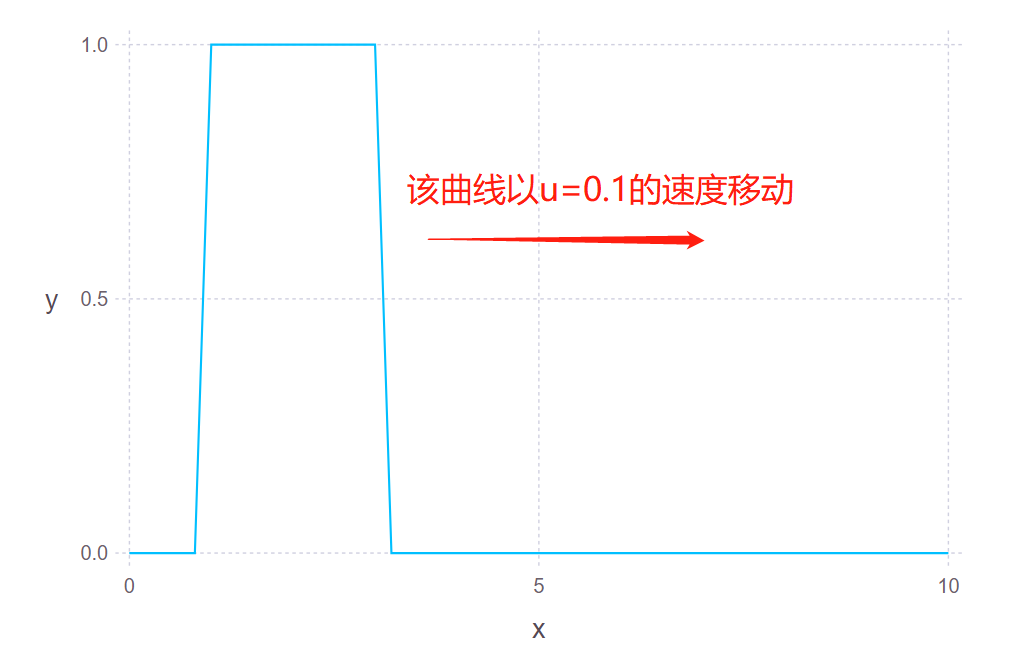
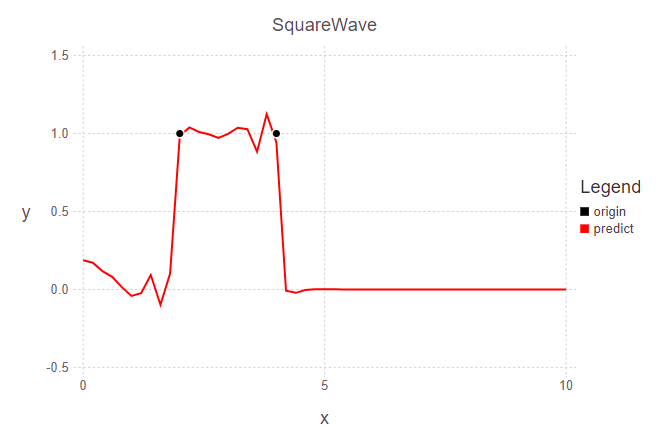
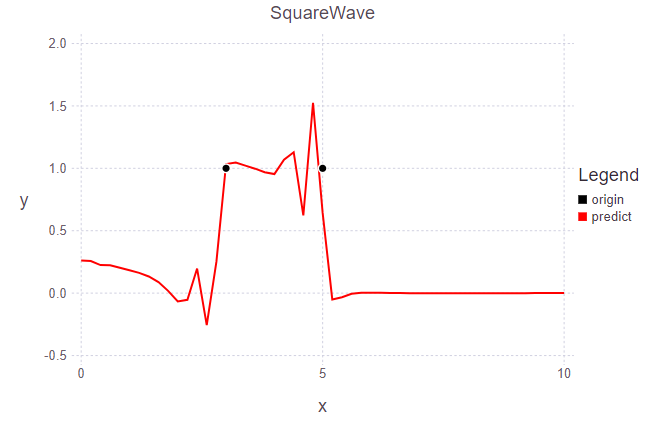
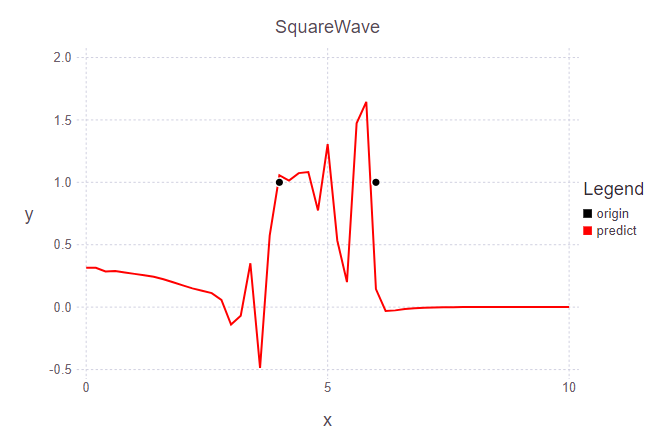
问题描述:初始值:当 0 < x < 1 ,y=0; 当 1 \leq x \leq 3 ,y=1; 当 3 < x < 10,y=0; 在控制方程(对流方程) \frac{\partial y}{ \partial t} +u\frac{\partial y}{ \partial x} = 0 下变化, 其中u常数0.1。
代码如下:
# 求解方波在对流方程控制下的运动
using Flux;
using Gadfly;
# 建立数据集
x = 0:0.2:10
y = [];
for xval in x
if xval < 1.0
append!(y, 0.0);
elseif xval > 3.0
append!(y, 0.0);
else
append!(y, 1.0);
end
end
x = collect(reshape(x, 1, :));
y = collect(reshape(Float64.(y), 1, :));
dataset = [(x, y)];
# 定义模型
m = Chain(Dense(1, 20, tanh),
Dense(20, 15, tanh),
Dense(15, 1));
ps = params(m);
loss(x, y) = Flux.mse(m(x), y); # 定义误差函数
opt = Descent(0.1);
for t in 1:3500
println("t = $(t)");
dataset = [(x, y)];
# 训练模型
for i in 1:10000
Flux.train!(loss, ps, dataset, opt);
if i%2000 == 0
println("第$(i)步的误差是$(loss(x, y))。");
end
end
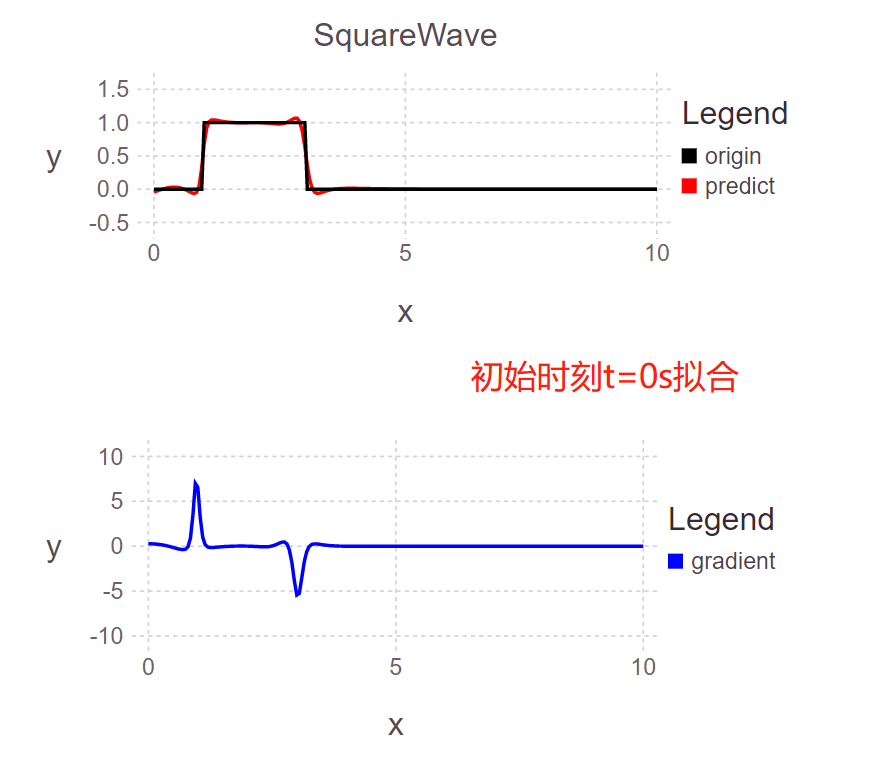
dy(x) = Tracker.forward(m, x)[2](1)[1].data;
y .-= 0.10 .* 0.10 .* dy(x);
if t%10 == 0
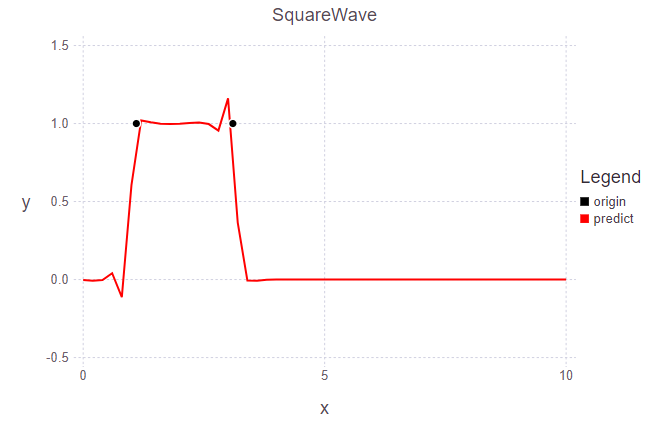
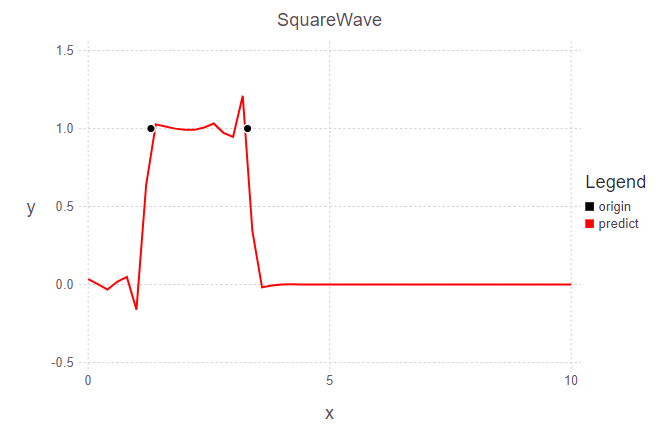
layer1 = Gadfly.layer(x=[1.0+0.01*t, 3.0+0.01*t], y=[1.0, 1.0], Geom.point, Theme(default_color="black"));
layer2 = Gadfly.layer(x=x, y=y, Geom.line, Theme(default_color="red", line_width=1.2pt));
fig1 = Gadfly.plot(layer1, layer2, Guide.xlabel("x"), Guide.ylabel("y"), Guide.title("SquareWave"), Guide.manual_color_key("Legend", ["origin", "predict"], ["black", "red"]));
fig1 |> SVG("example7_$(t).SVG");
end
end
结果如下:
t = 0 (0.0s)
t = 10 (1.0s)
t = 30 (3.0s)
t = 100 (10.0s)
t = 200 (20.0s)
t = 300 (30.0s)
不足:1、神经网络结构和参数未细细调节; 2、图片未输出gif动图;3、物理参数未调节,比如数据点个数,时间步长,边界处的导数(增加曲线两端的数据点)等等;其它暂未想到。
待完善。。。。。。