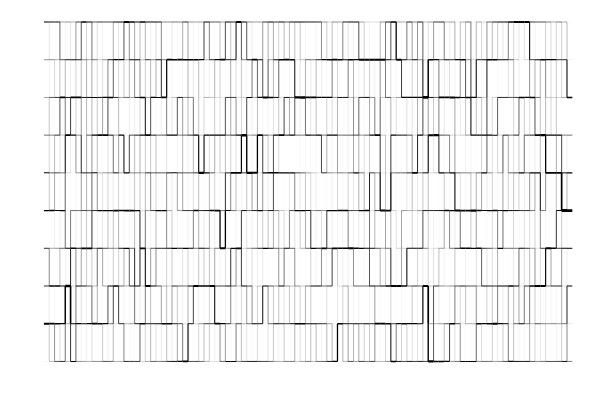
想要制作一个动画展示一个图的动态变化,位置不变但是每个边的宽度会变化。
、、、
using SparseArrays
using LightGraphs
using GraphPlot
using Plots
function PlotGraphWithLoc(G::Graph, Loc::Dict, Width::Dict=Dict())
#return x,y,lw that can reproduce the network
ne = LightGraphs.ne(G)
x = Array{Float64,2}(undef,2,ne)
y = Array{Float64,2}(undef,2,ne)
lws = ones(Float64,1,ne)
i = 1
if Width != Dict()
    width_max = maximum(values(Width))
    for e in edges(G)
        u,v = src(e), dst(e)
        x[1,i]=Loc[u][1]
        x[2,i]=Loc[v][1]
        y[1,i]=Loc[u][2]
        y[2,i]=Loc[v][2]
        lws[1,i] = Width[(u,v)]/width_max*3
        i += 1
    end
else
    for e in edges(G)
        u,v = src(e), dst(e)
        x[1,i]=Loc[u][1]
        x[2,i]=Loc[v][1]
        y[1,i]=Loc[u][2]
        y[2,i]=Loc[v][2]
        i += 1
    end
end
(x, y, lws)
end
N_x = 100
N_y = 10
N = N_x*N_y
xs = [fld(i,N_y) for i in 0:N-1]
ys = [rem(i,N_y) for i in 0:N-1]
A = zeros(N,N)
for i in 1:N, j in 1:N
    abs(xs[i]-xs[j])+abs(ys[i]-ys[j])== 1 ? A[i,j]=1 : nothing
end
G = Graph(A)
Locs=Dict([(i,[xs[i],ys[i]]) for i in 1:N]);
gr()
plot()
@time x_g,y_g,lws = PlotGraphWithLoc(G,Locs)
@time plot!(x_g,y_g,lw=lws,color=:black,legend=false,lt=:path)
scatter!([Locs[i][1] for i in 1:N_y],[Locs[i][2] for i in 1:N_y], label = nothing)
scatter!([Locs[i][1] for i in N-N_y+1:N],[Locs[i][2] for i in N-N_y+1:N], label = nothing)
这个是根据给的图,位置和每个边的宽度返回一个Plot可以识别的x,y,linewidth matrix。之后画出来,在我的电脑上大概0.7s吧
但是一但用下面这个animate
@time anim = @animate for t in 1:10:100
    x,y,lws= PlotGraphWithLoc(G,Locs, I_dict_time[t])
    plot(x,y,lw=lws,color=:black,legend=false,grid= false, axis=false)
end
mp4(anim,fps=10)
这里随便用一个I_dict_time都行,只要是map 边到float的,10帧就要25s,100帧要250s,不知道是怎么回事。感觉很不对啊。下面是单幅图。
