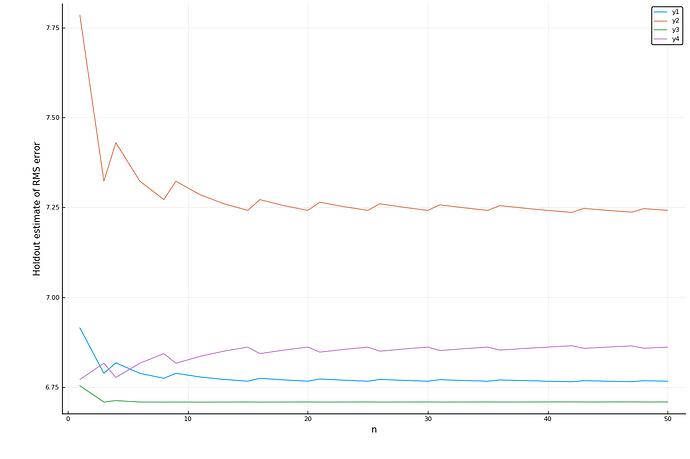
倘若我们已经准备好训练集和测试集, train_features, train_lables, test_feature, test_labels
ps: 看看就好,我没给出数据集
在MLJ中,我们的习惯是构造一个机器machine来包装模型model和数据
@load DecisionTreeClassifier
model = DecisionTreeClassifier()
mach = machine(model, train_features, train_labels)
这是model的参数
DecisionTreeClassifier(
    max_depth = -1,
    min_samples_leaf = 1,
    min_samples_split = 2,
    min_purity_increase = 0.0,
    n_subfeatures = 0,
    post_prune = false,
    merge_purity_threshold = 1.0,
    pdf_smoothing = 0.0,
    display_depth = 5) @706
对数据进行拟合后,要对机器进行评估
fit!(mach)
# resampling: 重采样策略
# measure: 评估指标
# weights: 权重
# shuffle: 是否打乱
evaluate!(mach, resampling = CV(nfolds = 6, shuffle = true, rng = 1234),
          measure = [area_under_curve, cross_entropy])
# also
# evaluate(model, train_features, train_labels,
            resampling = CV(nfolds = 6, shuffle = true, rng = 1234),
			measure = [area_under_curve, cross_entropy])
julia> evaluate!(mach, resampling = CV(nfolds = 6, shuffle = true, rng = 1234),
       measure = [area_under_curve, cross_entropy])
Evaluating over 6 folds: 100%[=========================] Time: 0:00:00
┌──────────────────┬───────────────┬──────────────────────────────────────────┐
│ _.measure        │ _.measurement │ _.per_fold                               │
├──────────────────┼───────────────┼──────────────────────────────────────────┤
│ area_under_curve │ 0.792         │ [0.73, 0.81, 0.788, 0.806, 0.785, 0.836] │
│ cross_entropy    │ 6.89          │ [8.54, 7.11, 7.11, 4.74, 7.11, 6.73]     │
└──────────────────┴───────────────┴──────────────────────────────────────────┘
_.per_observation = [missing, [[2.22e-16, 2.22e-16, ..., 2.22e-16], [2.22e-16, 2.22e-16, ..., 2.22e-16], [2.22e-16, 2.22e-16, ..., 2.22e-16], [2.22e-16, 36.0, ..., 2.22e-16], [36.0, 2.22e-16, ..., 2.22e-16], [2.22e-16, 2.22e-16, ..., 2.22e-16]]]
le = true, rng
如果对该机器的拟合效果不满意
可以要确定调整的参数范围,这里拿model的n_subfeatures属性为例
r = range(model, :n_subfeatures, lower = 0 , upper = 3 , scale = :linear)
再是要确定评估模型好坏的指标,这里选cross_entropy
cv = CV(nfolds = 6, shuffle = true, rng = 1234)
self_tuning_model = TunedModel(model = model,
                               range = r,
                               repeats = 3,  # repeats: 重采样次数
                               tuning = RandomSearch(),
                               resampling = cv,
                               measure = cross_entropy
			       n = n))  # n: 提供的调整模型个数,默认为default_n(tuning, range)
self_tuning_mach = machine(self_tuning_model, train_features, train_labels)
拟合后,取最优模型
fit!(self_tuning_mach)
best_model = fitted_params(self_tuning_mach).best_model
best_mach = machine(best_model, train_features, train_labels)
查看评估结果
julia> evaluate!(best_mach, resampling = cv,
       measure = [area_under_curve, cross_entropy])
Evaluating over 6 folds: 100%[=========================] Time: 0:00:00
┌──────────────────┬───────────────┬────────────────────────────────────────────┐
│ _.measure        │ _.measurement │ _.per_fold                                 │
├──────────────────┼───────────────┼────────────────────────────────────────────┤
│ area_under_curve │ 0.804         │ [0.714, 0.812, 0.819, 0.861, 0.771, 0.845] │
│ cross_entropy    │ 6.97          │ [9.01, 6.64, 7.59, 5.69, 6.64, 6.25]       │
└──────────────────┴───────────────┴────────────────────────────────────────────┘
_.per_observation = [missing, [[2.22e-16, 2.22e-16, ..., 2.22e-16], [2.22e-16, 2.22e-16, ..., 2.22e-16], [2.22e-16, 2.22e-16, ..., 2.22e-16], [2.22e-16, 2.22e-16, ..., 2.22e-16], [2.22e-16, 2.22e-16, ..., 2.22e-16], [2.22e-16, 2.22e-16, ..., 36.0]]]
如果要调整多个参数怎么办?
r1 = range(model, :hyper1, ...)
r2 = range(model, :hyper2, ...)
self_tuning_model = TunedModel(model = model, range = [r1, r2], ...)
也可以用学习曲线 learning_curve先看看参数范围对评估结果的影响
同样要确定参数范围, 重采样策略和评估标准
curve = learning_curve(mach,
	                   range = r_n,
                       resampling = Holdout(fraction_train = 0.8, shuffle = true, rng = 1234),
					   measure = cross_entropy)


plot(curves.parameter_values,
     curves.measurements,
     xlab = curves.parameter_name,
     ylab = "Holdout estimate of cross_entropy error")

最后,经过各种调整后,取得最优模型,r投入应用
best_model = fitted_params(self_tuning_mach).best_model
best_machine = machine(best_model, train_features, train_labels)
predict_labels = predict(best_machine, test_features)
用测试样本评估
julia> evaluate(best_model, test_features, test_labels,
       resampling = cv,
       measure = [area_under_curve, cross_entropy])
Evaluating over 6 folds: 100%[=========================] Time: 0:00:00
┌──────────────────┬───────────────┬──────────────────────────────────────────┐
│ _.measure        │ _.measurement │ _.per_fold                               │
├──────────────────┼───────────────┼──────────────────────────────────────────┤
│ area_under_curve │ 0.849         │ [0.782, 0.9, 0.923, 0.872, 0.786, 0.833] │
│ cross_entropy    │ 6.64          │ [7.59, 3.79, 5.69, 9.49, 7.59, 5.69]     │
└──────────────────┴───────────────┴──────────────────────────────────────────┘
_.per_observation = [missing, [[2.22e-16, 2.22e-16, ..., 36.0], [2.22e-16, 2.22e-16, ..., 2.22e-16], [36.0, 2.22e-16, ..., 2.22e-16], [2.22e-16, 36.0, ..., 2.22e-16], [2.22e-16, 2.22e-16, ..., 36.0], [2.22e-16, 2.22e-16, ..., 36.0]]]
总结一下[个人理解]
流程: machine 构造 → 评估 → 调整–>评估 → 投入应用
几点疑惑
-
TunedModel
1.1 模型调整中 GridSearch调整策略的参数
Grid(goal=nothing, resolution=10, rng=Random.GLOBAL_RNG, shuffle=true)
rng,shuffle我都清楚,不过goal和resolution我就不知道了
1.2 TunedModel 中参数n的确定
n=default_n(tuning, range)
也可以自己设定, 现在我不知道tuning策略与range有什么关系,尤其是GridSearch
1.3 range中的scale
文档是这么写的
> If scale is unspecified, it is set to :linear, :log, :logminus, or :linear,
according to whether the interval (lower, upper) is bounded, right-unbounded,
left-unbounded, or doubly unbounded, respectively. Note upper=Inf and lower=-Inf
are allowed.
我的问题是,这玩样是不是从lower到upper,然后画一条scale的曲线,他的个数与tuning策略之间会相互影响吗? -
learning_curve
2.1 绘制多条曲线
在文档里我只看到EnsembleModel的例子```julia X, y = @load_boston atom = @load RidgeRegressor pkg=MultivariateStats ensemble = EnsembleModel(atom = atom, n = 1000) mach = machine(ensemble, X, y) atom.lambda = 200 r_n = range(ensemble, :n, lower = 1, upper = 50) curves = learning_curve(mach, range = r_n, rng_name = :rng, rngs = 4, resampling = Holdout(fraction_train = 0.8)) plot(curves.parameter_values, curves.measurements, xlab = curves.parameter_name, ylab = "Holdout estimate of RMS error") ```
最后
谁能告诉我markdown怎么贴那种精致的表格,我的evaluate结果全被打乱了
