using Distributions
using Plots
theme(:wong)
gr()
a = MvNormal([2,0.5], [0.2, 0.6])
b = MvNormal([1,1], [0.4, 0.3])
c = MvNormal([1, 2],[0.2, 0.5] )
gmm1 = MixtureModel(MvNormal[a,b,c], [0.2, 0.3, 0.5])
x1 = -1:0.01:6
y1 = -1:0.01:6
Z1 = [pdf(gmm1,[j,i]) for i in y1, j in x1]
d = MvNormal([4.5,2], [0.5, 0.4])
e = MvNormal([4,3], [0.3, 0.6])
f = MvNormal([3, 3.5],[0.7, 0.4] )
gmm2 = MixtureModel(MvNormal[d,e,f], [0.1, 0.5, 0.4])
# x2 = 3:0.01:5
# y2 = 3:0.01:5
Z2 = [pdf(gmm2,[j,i]) for i in y1, j in x1]
# surface(x1, y1, Z1, showaxis=true)
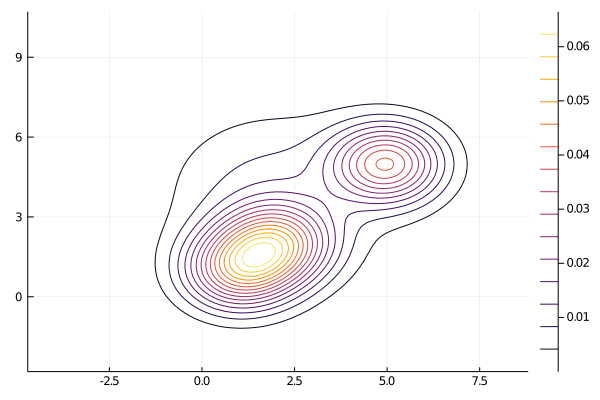
contour(x1,y1,Z1,grid=0,fill=false)
contour!(x1,y1,Z2, grid=0,fill=false)
using Random
data1 = zeros(2,100)
# for i in 1:100
# Random.seed!()
# tmp = rand(gmm1,1)
# data1[:,i] = tmp
# end
Random.seed!()
data1 = rand(gmm1, 100)
xx1 = data1[1,:]
yy1 = data1[2,:]
label1 = zeros(100,1)
plot!(xx1,yy1, seriestype = :scatter, label = "dddd", color = "red", legend = :bottomright)
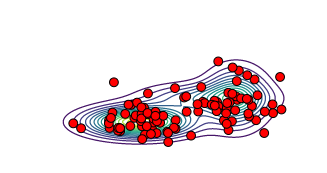
需要注意的是 [pdf(gmm1,[j,i]) for i in y1, j in x1], 以前写的[i,j] ,导致最后采样画的图不对, 感谢群里几位朋友提醒,我倒过来发现是对的。
以前的图:
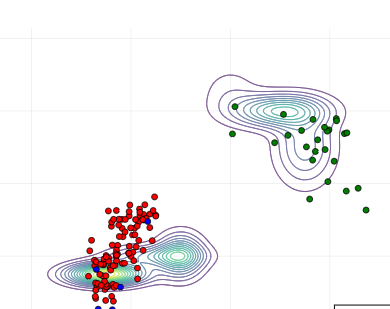
现在的图:
可是为啥 [pdf(gmm1,[j,i]) for i in y1, j in x1] 就正过来了, 我还没想清楚
恩,想清楚了,contour 传入的(x1,y1, Z2) 中, contour 自己根据x1, y1计算的坐标矩阵应该和Z2计算的顺序一致。。