using Distributions
using Plots
theme(:wong)
gr()
a = MvNormal([0,0.5], [0.2, 0.6])
b = MvNormal([1,1], [0.4, 1])
c = MvNormal([-0.5, -1],[1, 0.5] )
gmm1 = MixtureModel(MvNormal[a,b,c], [0.2, 0.3, 0.5])
x1 = -3:0.01:6
y1 = -3:0.01:6
Z1 = [pdf(gmm1,[i,j]) for i in x1, j in y1]
d = MvNormal([3,2], [0.3, 0.1])
e = MvNormal([2,2], [1, 0.6])
f = MvNormal([2, 3],[0.5, 1] )
gmm2 = MixtureModel(MvNormal[d,e,f], [0.1, 0.5, 0.4])
# x2 = 3:0.01:5
# y2 = 3:0.01:5
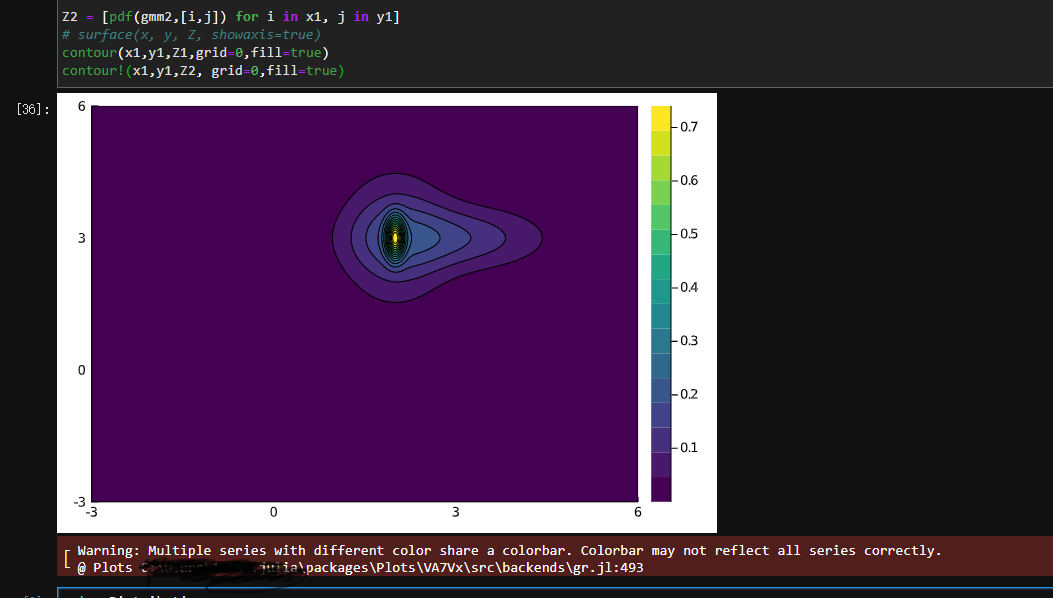
Z2 = [pdf(gmm2,[i,j]) for i in x1, j in y1]
# surface(x, y, Z, showaxis=true)
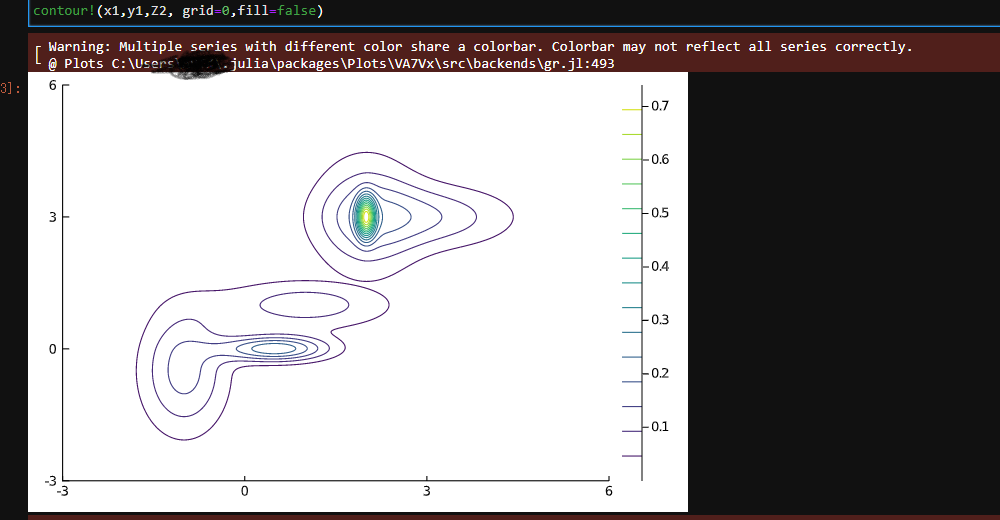
contour(x1,y1,Z1,grid=0,fill=false)
contour!(x1,y1,Z2, grid=0,fill=false)
目前用在这种第二次添加的方式, colorbar 是不统一的
而且,如果fill=true, 图只能显示最后一个