using Plots
using Random
using Distributions
x = rand(Normal(), 10000)
y = rand(Normal(), 10000)
histogram2d(x, y, color=cgrad(scale=:log10))
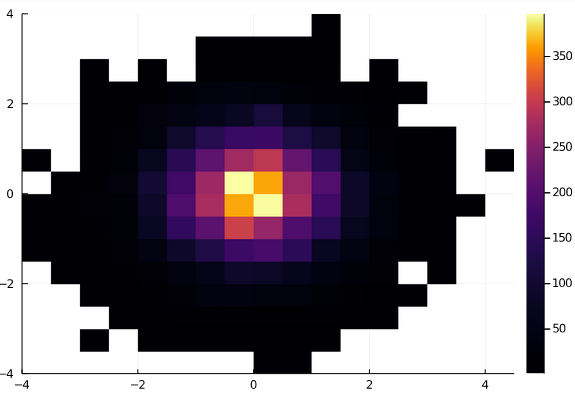
画图后仍然是线性colorbar,如何画成对数的?
using Plots
using Random
using Distributions
x = rand(Normal(), 10000)
y = rand(Normal(), 10000)
histogram2d(x, y, color=cgrad(scale=:log10))
画图后仍然是线性colorbar,如何画成对数的?