using DataFrames, Gadfly

set_default_plot_size(24cm, 10cm)

# 这个函数不用关注
function todf(data)
    (m, n) = size(data)

    X = [[] [] [] []]
    for i in 1:m
        X = vcat(X, hcat(algo, data[i, :], repeat([symb[i]], n), string.(data[i, :])))
    end

    return DataFrame(X, [:Algorithm, :Number, :Label, :Number_s])
end


algo = ["Algo1", "Algo2"]
symb = ["↑", "∼", "↓"]

data1 = [21 20
        2 3
        7 7]

data2 = [37 32
        0 5
        13 13]

df = vcat(
transform(todf(data1), AsTable(:) => ByRow((x)->3) => :Tasks),
transform(todf(data2), AsTable(:) => ByRow((x)->5) => :Tasks)
)

# Tasks .== 3 的bar图
p1 = plot(df[df.Tasks .== 3,:], x=:Algorithm, y=:Number, color=:Label,
    label=:Number_s,
    Geom.label(position=:centered),
    Stat.dodge(position=:stack),
    Geom.bar(position=:stack),
    Scale.x_discrete(levels = algo),
);

# Tasks .== 5 的bar图
p2 = plot(df[df.Tasks .== 5,:], x=:Algorithm, y=:Number, color=:Label,
    label=:Number_s,
    Geom.label(position=:centered),
    Stat.dodge(position=:stack),
    Geom.bar(position=:stack),
    Scale.x_discrete(levels = algo)
);

# 通过分组的形式画
p3 = plot(df, xgroup=:Tasks,
    Geom.subplot_grid(layer(
    x=:Algorithm, y=:Number, color=:Label,
    label=:Number_s,
    Geom.label(position=:centered),
    Geom.bar(position=:stack)
    )),
    Stat.dodge(position=:stack),
    Scale.x_discrete(levels = algo)
);

hstack(p1, p2, p3)
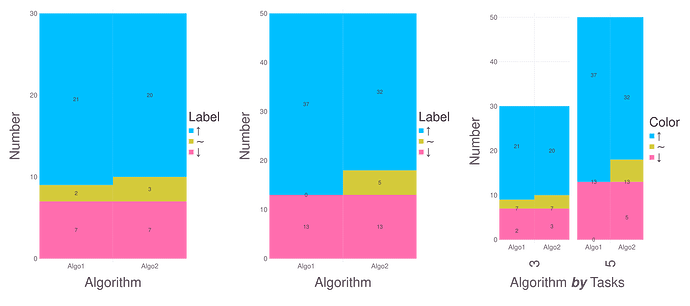
绘图结果如下所示:
可以发现,左边两个图(分别画的)和最右边图(分组画到一个图内)是有区别的。
区别在于:Label的标注上,无论是位置还是顺序p3都是有问题的。
比如p1中Algo1的:Label自上而下分别是21-2-7,而p3中左图却为21-7-2。
按说应该是一致的啊,大家遇到过这样的问题嘛?
