发现Plots包legend的linewidth好像和line的linewidth不一样。
比如下面这个图,我希望legend第二条线(橙色线)的linewidth为3
using Plots
plot(1:10, rand(10))
	plot!(1:10, rand(10), lw=3)
发现Plots包legend的linewidth好像和line的linewidth不一样。
比如下面这个图,我希望legend第二条线(橙色线)的linewidth为3
using Plots
plot(1:10, rand(10))
plot!(1:10, rand(10), lw=3)
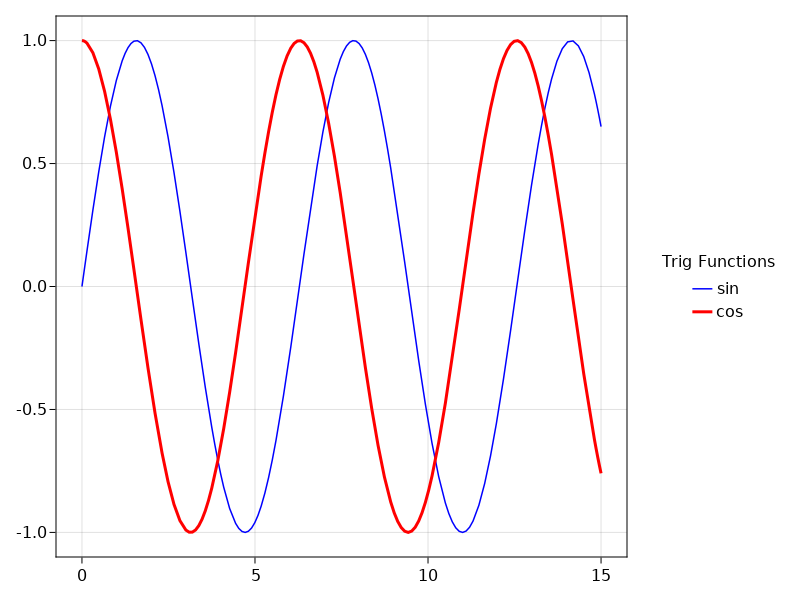
Try Makie:
using CairoMakie

f = Figure();

ax = f[1, 1] = Axis(f)

lines!(0..15, sin, label = "sin", color = :blue)

lines!(0..15, cos, label = "cos", color = :red, linewidth = 3)

f[1, 2] = Legend(f, ax, "Trig Functions", framevisible = false)

f
Plots 包或许要手动设置一下 legend? 换个backend?
好的,谢谢你,我去看看这个包!
Plots找不到怎么设置 ![]()