如题
using Gadfly, DataFrames
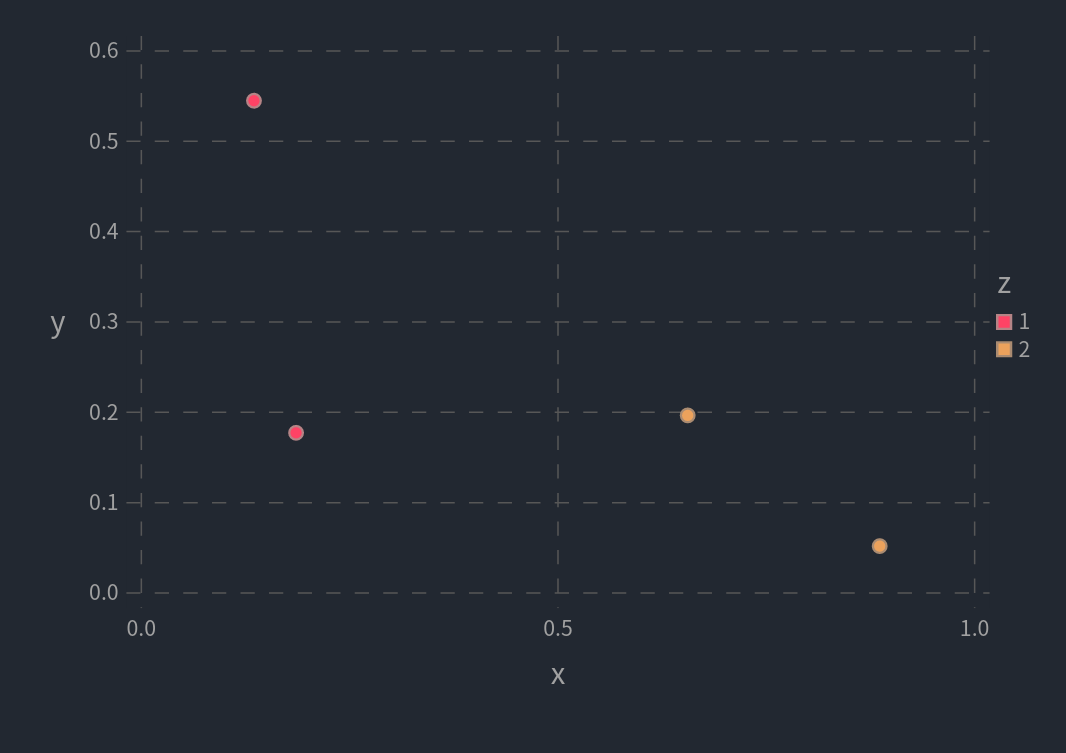
X = DataFrame(:x=>rand(4),:y=>rand(4),:z=>["1", "1", "2", "2"])
Gadfly.with_theme(:dark) do
plot(X, x=:x, y=:y, color=:z)
end
绘图结果如上 所示,如何将右边的z 1 2去掉(在:dark主题下)
也就是要去掉 Legend。
Gadfly.with_theme(Theme(Gadfly.dark_theme, key_position=:none)) do
    plot(X, x=:x, y=:y, color=:z)
end
opened 05:28AM - 12 Jun 20 UTC
It was possible to hide a manual color key in the plot by setting theme `key_pos… ition` to `:none` until 1.2.1, but no longer works with 1.3.
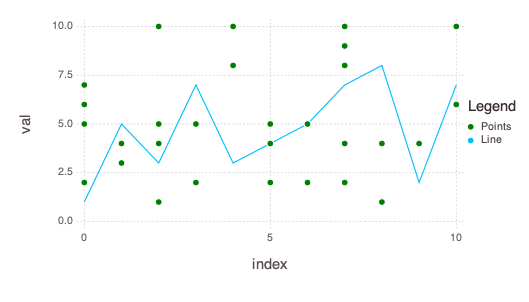
A sample plot from [the guide](http://gadflyjl.org/stable/gallery/guides/#[Guide.manual_color_key](@ref)-1) with a custom theme:
```julia
using Gadfly, DataFrames
set_default_plot_size(14cm, 8cm)
points = DataFrame(index=rand(0:10,30), val=rand(1:10,30))
line = DataFrame(val=rand(1:10,11), index = collect(0:10))
pointLayer = layer(points, x="index", y="val", Geom.point,Theme(default_color="green"))
lineLayer = layer(line, x="index", y="val", Geom.line)
plot(pointLayer, lineLayer,
Guide.manual_color_key("Legend", ["Points", "Line"], ["green", "deepskyblue"]),
Theme(key_position=:none)
)
```
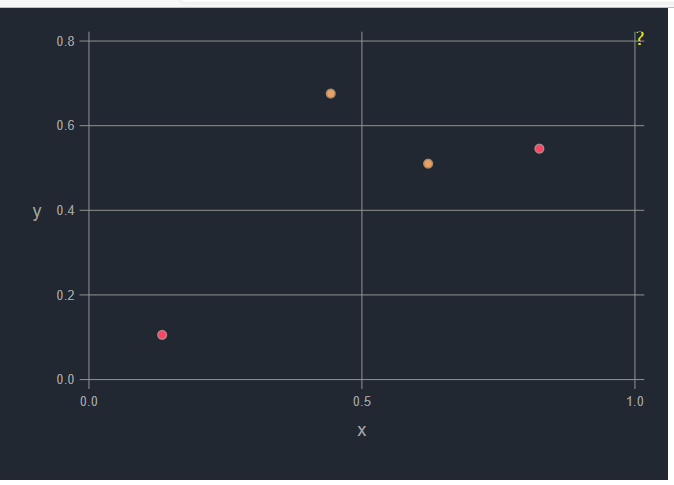
Gadfly 1.2.1 (key hidden -- GOOD)
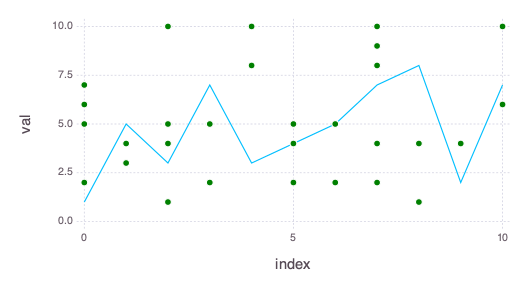
Gadfly 1.3 (key not hidden -- NO GOOD)
这个包文档不多,我是在源码里搜出来的
2 个赞
我以plot( X, x=:x, y=:y, color=:z, Guide.colorkey(pos=[0,0]))这种方式实现的,因为文档里提到 ... pos overrides Theme(key_position=) and can be in either relative (e.g. [0.7w, 0.2h] is the lower right quadrant), absolute (e.g. [0mm, 0mm]), or plot scale (e.g. [0,0]) coordinates.,但是又觉得肯定不对