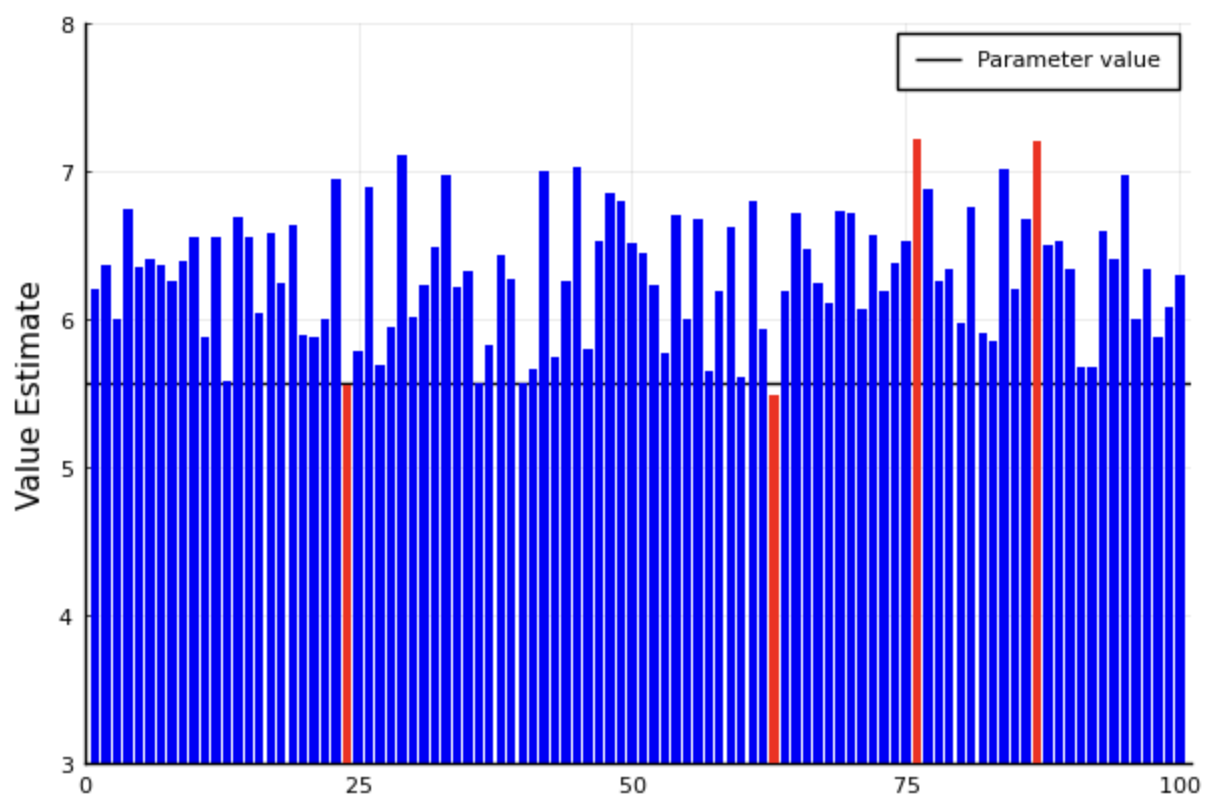
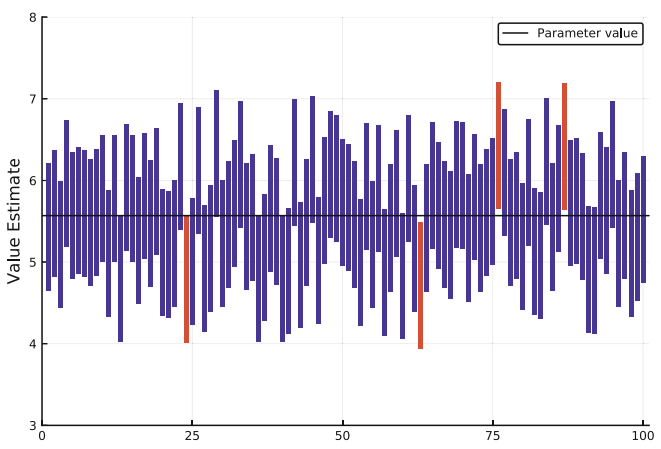
代码运行结果如第一幅图所示,但是自己运行结果并不是这幅图,请问是什么原因,怎么解决呢
using Random, Distributions, StatsPlots; pyplot()
Random.seed!(2)

alpha = 0.05
L(obs) = obs - (1-sqrt(alpha))
U(obs) = obs + (1-sqrt(alpha))

mu = 5.57
triDist = TriangularDist(mu-1,mu+1,mu)

N = 100
hitBounds, missBounds = zeros(N, 2), zeros(N,2)
for i in 1:N
	observation = rand(triDist)
	LL, UU = L(observation), U(observation)
	if LL <= mu && mu <= UU
		hitBounds[i,:] = [LL UU-LL]
	else
		missBounds[i,:] = [LL UU-LL]
	end
end

groupedbar(hitBounds, bar_position=:stack,
	c=:blue, la=0, label="", ylims=(3,8))
groupedbar!(missBounds, bar_position=:stack,
	c=:red, la=0, label="", ylims=(3,8))
plot!([0,N+1],[mu,mu],
	c=:black, xlims=(0,N+1),
	ylims=(3,8), label="Parameter value", ylabel="Value Estimate")