先上代码
# code
module Gausslegendre1D
using Plots
pyplot()
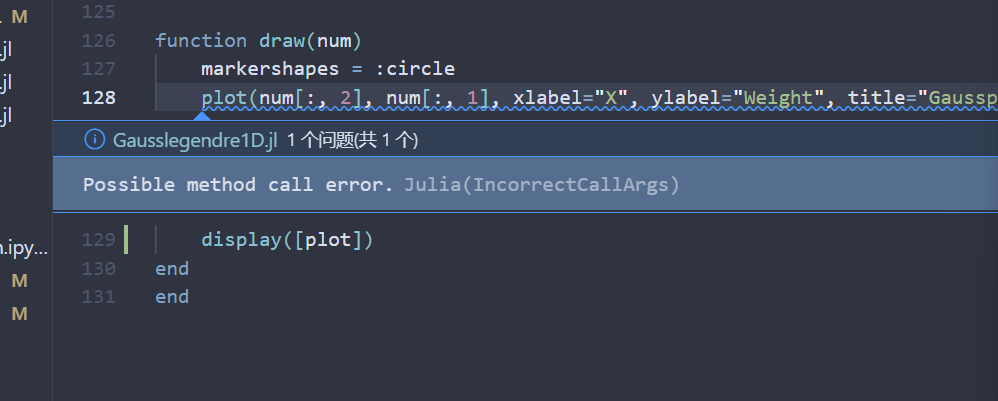
function draw(num)
markershapes = :circle
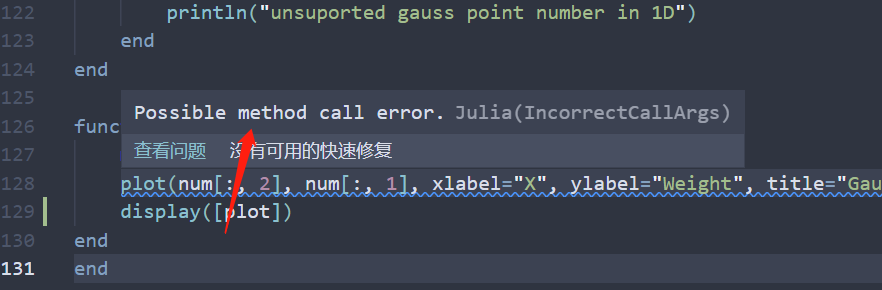
plot(num[:, 2], num[:, 1], xlabel="X", ylabel="Weight", title="Gausspoints1D", seriestype=:scatter, shape=markershapes, markersize=3)
end
end
我在vscode下面写了关于在函数中调用plot的代码,但是它会给我反馈一个警告,虽然能使用,但是我想问一下是否有更合适的用法
Ailuj
4
在函数中是可以用的,只要函数头儿跟plot()的参数对应上。
报错的话,你得把错误信息搬过来呀,要不然别人怎么帮你?
我写的[plt]表示“可选”的意思。不指定哪幅图,直接display()也可以。只是当你有很多图plt1,plt2时就需要指定。
另外,你画的图(变量记为plt),也可以作为传出。后续想要更改它的话,用plot!([plt], ...)就好。
官方文档Getting Started-Basic里第一段就是这么写的:
plot(args...; kw...)                  # 创建一个新的Plot对象, 并将它设置为`current`
plot!(args...; kw...)                 # 更改Plot对象:`current()`
plot!(plt, args...; kw...)            # 更改变量名为`plt`的Plot对象