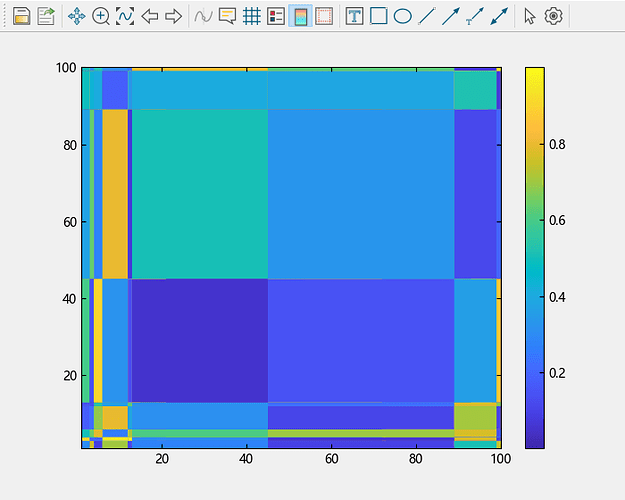
画伪彩图不是很方便。
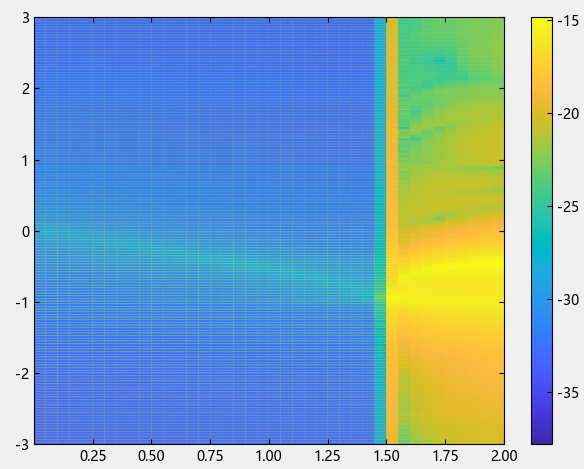
本来MATLAB代码是(我精简过):
figure;
h=pcolor(xvec,yvec,zmat);
set(h,'edgecolor','none','facecolor','interp');
colorbar;
grid on;
set(gcf,'position',[10,10,1500,1000])
ylim([-3 3]);
AI换成Julia代码是:
using Plots

heatmap(
        xvec, yvec, zmat,
        color=:viridis, grid=false, cbar=true
        )
plot!(xlims=(0, 2), ylims=(-3, 3), size=(1500, 1000))
但是它会报错:
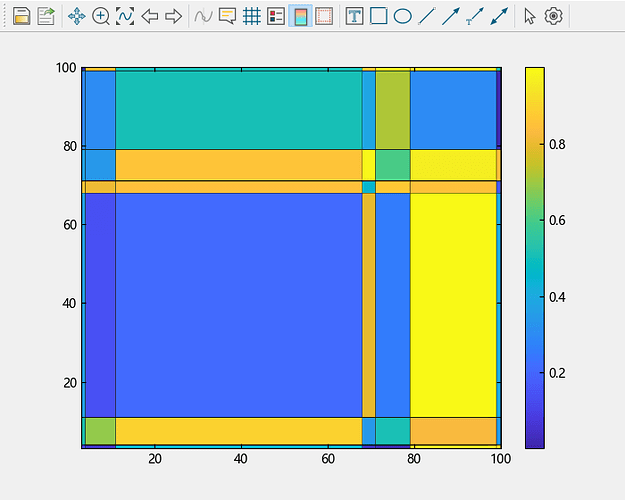
ERROR: MethodError: no method matching ty_heatmap(::Vector{Float64}, ::Vector{Float64}, ::Matrix{Float64}; color=:viridis, grid=false, cbar=true)
Closest candidates are:
  ty_heatmap(::PyCall.PyObject, ::Any, ::Any; cmap, xlabel, ylabel, colorvariable, colormethod, norm, annot, rotation, fmt, kwargs...) at C:\Users\Public\TongYuan\.julia\dev\TyPlot\src\Image Plots\ty_heatmap.jl:78
  ty_heatmap(::Any, ::Any; cmap, xlabel, ylabel, xvalues, yvalues, colorvariable, colormethod, norm, annot, rotation, fmt, kwargs...) at C:\Users\Public\TongYuan\.julia\dev\TyPlot\src\Image Plots\ty_heatmap.jl:165
  ty_heatmap(::PyCall.PyObject, ::Vector; cmap, xlabel, ylabel, xvalues, yvalues, norm, annot, rotation, fmt, kwargs...) at C:\Users\Public\TongYuan\.julia\dev\TyPlot\src\Image Plots\ty_heatmap.jl:20
  ...
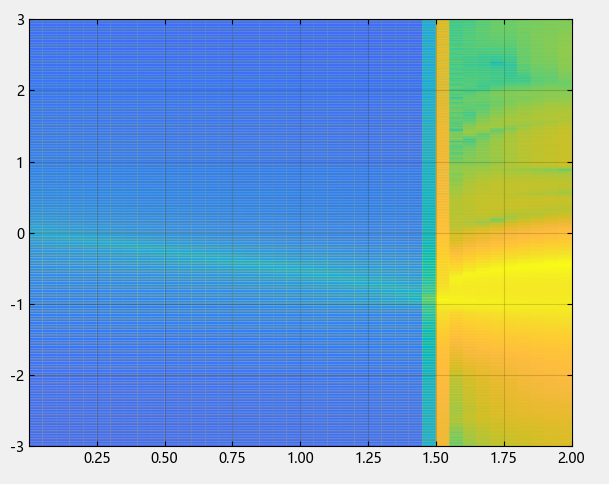
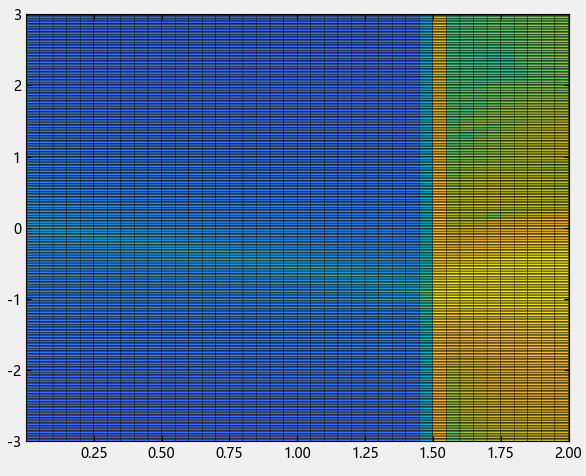
我希望能有MATLAB那样interp的功能。Syslab官方的pcolor说明文档没有这种说明。
