1、Plots初识
1.1 包特点
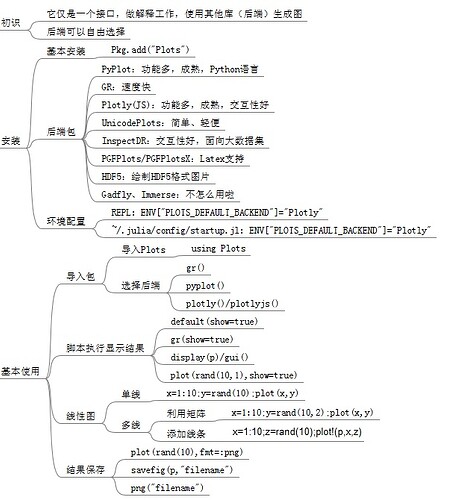
它是一个可视化接口和工具集,位于其他后端之上(比如GR、PyPlot、Plotly等),将画图命令与这些后端实现连接起来。
1.2 基本安装
1.2.1 安装Plots
import Pkg;Pkg.add("Plots")
1.2.2 自行安装后端包
Pkg.add("GR")
Pkg.add("PyPlot")
Pkg.add("Plotly")
1.2.3 第一个画图
先导入包,以及声明后端,再调用接口函数plot(x,y)画图。y坐标可使用矩阵同时画多条线,矩阵的每列作为一个系列。可使用函数plot!(p,x,z)向p=plot(x,y)图上添加系列线条。
using Plots
x=1:10;y=rand(10,2)
p=plot(x,y)
z=rand(10)
plot!(p,x,z)
如果未声明后端,将会自动查找已安装后端,windows用户可配置默认的后端。在~/.julia/config/startup.jl文件中ENV["PLOTS_DEFAULT_BACKEND"="PlotlyJS"
在REPL中执行plot()函数会自动显示画图结果,但在*.jl文件中需要显示调用才会显示结果。这里有以下几种方式。
-
默认设置:default(show=true)
-
声明后端时设置:gr(show=true)
-
函数display()或者display(p)
-
函数gui()或者gui(p)
-
函数plot(x,y,show=“true”)
1.2.4 将结果保存成图片
使用以下三种方式可将画图结果保存。
-
savefig(p,“img.png”)
-
png(“img”)
-
plot(rand(10),fmt=:png)
2、相关属性设置
2.1 常用属性
2.1.1 plot函数中设置
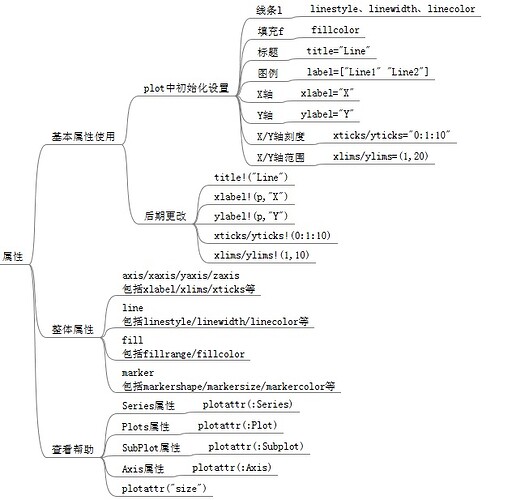
在使用plot()函数时,可以显示设置一些属性。常用的属性如下:
| 属性名 | 功能 | 举例 |
|---|---|---|
| title | 标题 | |
| label | 图例 | label=["line1" "line 2"] |
| xlabel | X轴 | |
| ylabel | Y轴 | |
| xticks | X轴刻度 | xticks="0:1:10" |
| yticks | Y轴刻度 | |
| xlims | X轴范围 | xlims=(1,20) |
| ylims | Y轴范围 | |
| linewidth | 线条粗细 | lw=3 |
| linecolor | 线条颜色 | lc=["blue" "green"] |
| linestyle | 线条风格 | ls=[:dash :dot] |
| markercolor | 点标志颜色 | mc=[:orange :purple] |
| markershape | 点标志形状 | shape=[:circle :star5] |
| markersize | 点标志大小 | ms=5 |
| fillcolor | 填充颜色 | fc="red" |
| background | 背景颜色 | bg="white" |
2.1.2 专门的属性函数设置
另外一种属性设置方法是对p=plot()后期更改属性,主要使用方法如下。以下只列举少量函数,其他大部分函数类似。(没有找到图例对应的函数)
| 函数 | 对应属性 |
|---|---|
| title!() | title |
| xlabel!() | xlabel |
| ylabel!() | ylabel |
| xticks!/yticks!() | xticks/yticks |
| xlims!/ylims!() | xlims/ylims |
2.2 多功能属性设置
这儿存在一些属性,通过对它的设置可以达到以上几个属性的设置效果,主要如下:
| 属性 | 对应以上属性组合 |
|---|---|
| axis/xaxis/yaxis | xlabel+xlims+xticks |
| line | linestyle+linewidth+linecolor |
| fill | fillrange+fillcolor |
| marker | markershape+markersize+markercolor |
2.3 查看自己想要的属性
Plot包下的属性主要可分为四类:Series、Plots、SubPlot、Axis。可分别通过plotattr(:Series)、plotattr(:Plot)、plotattr(:Subplot)、plotattr(:Axis)查看该类主要提供哪些属性。再可以通过plotattr("attrname")了解具体属性的使用方法。
- Series类主要设置系列图相关的属性,比如线条颜色。
- Plot类主要设置画图相关的属性,比如画图窗口大小位置。
- Subplot类主要设置子图相关的属性,比如每个子图的图例。
- Axis类主要设置坐标轴相关的属性。
3、高级用法
3.1 各种系列图
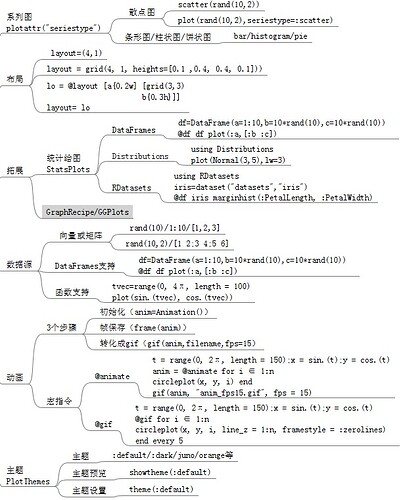
在对数据进行可视化时,可以选择不同的系列类型,一般默认是线条,另外自己可以指定为其他类型,比如散点图、条形图、柱状图、饼形图等。主要以以下两种方式指定。
- plot()中通过seriestype属性指定。比如
seriestype=:scatter,具体有哪些类型可通过plotattr("seriestype")查看。 - 可以直接调用类型函数。比如scatter()。
3.2 子图与布局
我们可以使用布局将多个图组合在一起作为子图,这里有两个简单方法生成子图。
方法一:
plot(rand(10,4),layout=(2,2))
方法二:
p1=plot(rand(10))
p2=scatter(rand(10))
p3=histogram(rand(10))
p4=bar(rand(10))
plot(p1,p2,p3,p4,layout=4)
此外,为了对子图进行更加个性化的设置,布局还可以通过grid()函数或者宏定义@layout构造一个特定布局。
grid函数举例:
plot(rand(100,4),layout=grid(4,1),heights=[0,1,0,4,0,4,0,1])
宏定义@layout举例:
l = @layout [
    a{0.3w} [grid(3,3)
             b{0.2h}  ]
]
plot(rand(10, 11),
    layout = l,  seriestype = [:bar :scatter :path]
)
3.3 拓展基本使用(recipe)
考虑到自己去延伸拓展plot比较复杂,这里仅简单介绍使用一些基本的拓展,主要用到的拓展包是StatsPlots.jl。因此使用以下拓展前,应先安装该包Pkg.add("StatsPlots")。
3.3.1 对数据类型拓展
这里主要是方便数据类型来自DataFrame。通过宏定义@df来声明该数据,然后plot()函数中可以通过列名来引用DataFrame类型数据。
举例如下:
using StatsPlots
using DataFrames
df = DataFrame(a = 1:10, b = 10 * rand(10), c = 10 * rand(10))
@df df plot(:a, [:b :c])
3.3.2 对特定类型拓展
这里主简单介绍对一些特定的分布图直接引用。比如正态分布。
using Distributions
plot(Normal(3, 5), lw = 3)
3.3.3 画图拓展
这里不是很熟悉,图看不的太懂。仅将示例代码附上,供了解。
using RDatasets, StatsPlots
iris = dataset("datasets", "iris")
@df iris marginalhist(:PetalLength, :PetalWidth)
3.3.4 系列图拓展
除了基本的系列图之外,这里还可以利用一些特殊的系列图。
y = rand(100, 4)
violin(["Series 1" "Series 2" "Series 3" "Series 4"], y, leg = false)
3.4 数据源
3.4.1 矩阵
传递一个n*m矩阵将创建m个系列,每个系列有n个数据点。
using Plots
xs=range(0, 2π, length = 10)
data=[sin.(xs) cos.(xs) 2sin.(xs) 2cos.(xs)]
labels=["Apples" "Oranges" "Hats" "Shoes"]
markershapes=[:circle :star5 :rect :+]
colors=[:green :orange :red :yellow]
plot(xs,data,label=labels,shape=markershapes,color=colors)
3.4.2 函数
通常可以使用函数来代替输入数据,并根据需要对它们进行映射。这时,2D和3D参数图也可以创建,范围可以通过向量或最小/最大值给出。
using Plots
tmin = 0
tmax = 4π
tvec = range(tmin, tmax, length = 100)
plot(sin.(tvec), cos.(tvec))
上面的plot可以等价于如下两种形式:
plot(sin, cos, tvec)
plot(sin,cos,tmin,tmax)
3.4.3 DataFrame类型
正如前面提到的,在使用StatsPlots拓展包时可以使用DataFrame类型数据,这时列名作为一列数据。
using StatsPlots, RDatasets
iris = dataset("datasets", "iris")
@df iris scatter(
    :SepalLength,
    :SepalWidth,
    group = :Species,
    m = (0.5, [:+ :h :star7], 12),
    bg = RGB(0.2, 0.2, 0.2)
)
3.5 颜色设置的高级用法
有许多颜色属性,用于线条、填充、标记、背景和前景,颜色属性可以接受许多不同的类型。
-
符号或者字符串。:red等价于"red"
-
RGB颜色,这里默认RGB(A,B,C)里面用的是0-1之间的数,A=a/255、B=b/255、C=c/255。
-
一个整数,自动会选择相对应的颜色。
using Plots
p1=plot(rand(10),lc=:red)
p2=plot(rand(10),st=:scatter,lc=10)
p3=plot(rand(10),lc=RGB(0.1,0.2,0.3))
plot(p1,p2,p3,layout=(3,1))
<各种颜色名称> 另外可以通过color_palette设置颜色,这时候color=:auto。palette的值可以借助Plots.ColorScheme,主要包括ColorVector、 ColorGradient。


